Thank you for using Easy Subscription. We have added the ability to analyze customers who have purchased subscriptions to your dashboard.
With the release of this feature, the total sales, number of new customers, number of existing customers, and cohort (percentage decrease from the time the customer was acquired) by subscriber can now be viewed.
- Data will be reflected approximately 24 hours after purchase of subscriptions.
- You can set a time period of the past 30 or 90 days.
- Graphs can be displayed for total sales, new customers, existing customers, and cohorts, respectively.
How to use
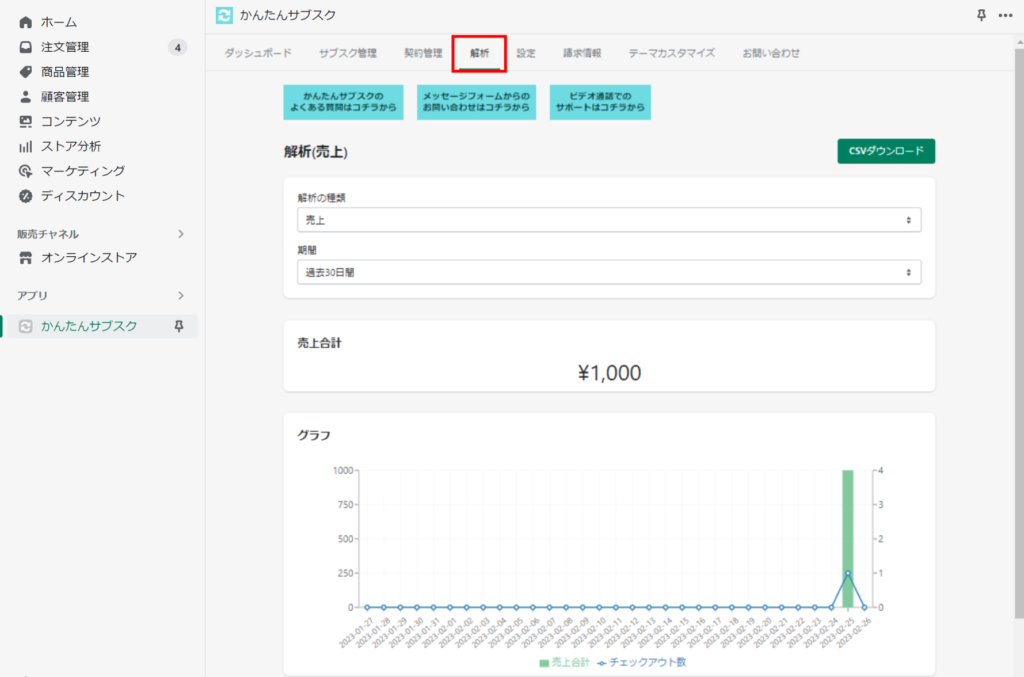
1. Click on "Analysis" on the Kantan Subsc. dashboard.
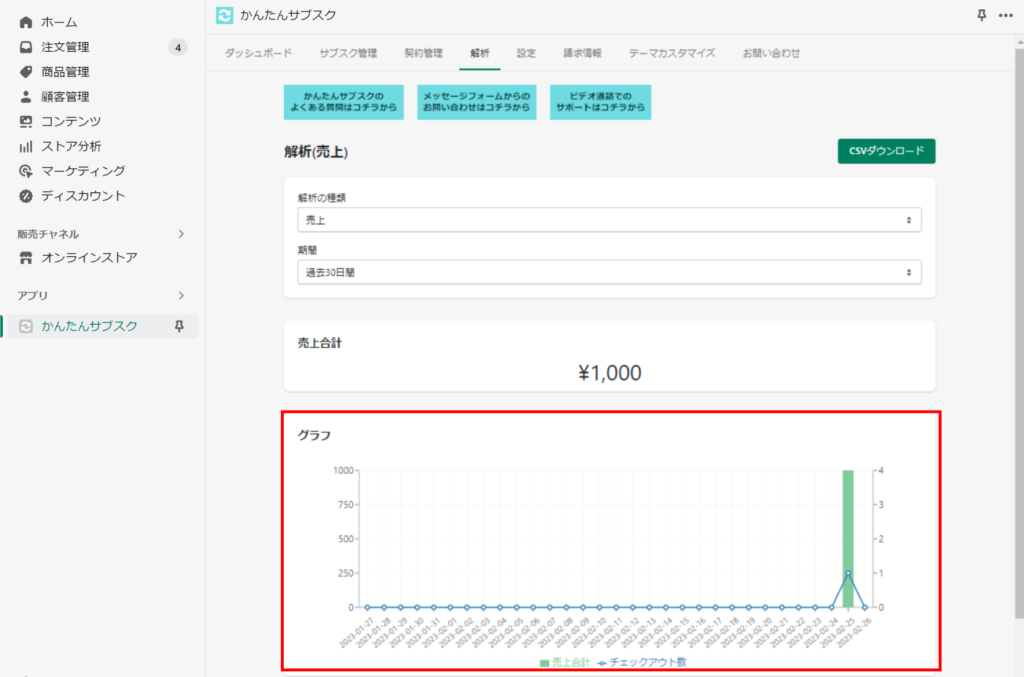
2. By selecting the type of analysis and the time period, an analysis graph of the results will be displayed.
Results can be downloaded in CSV format.